
Specialized AI Tools in 2026: A Practical Directory by Profession and Task
October 14, 2026
Build an AI Knowledge System With Provenance
October 14, 2026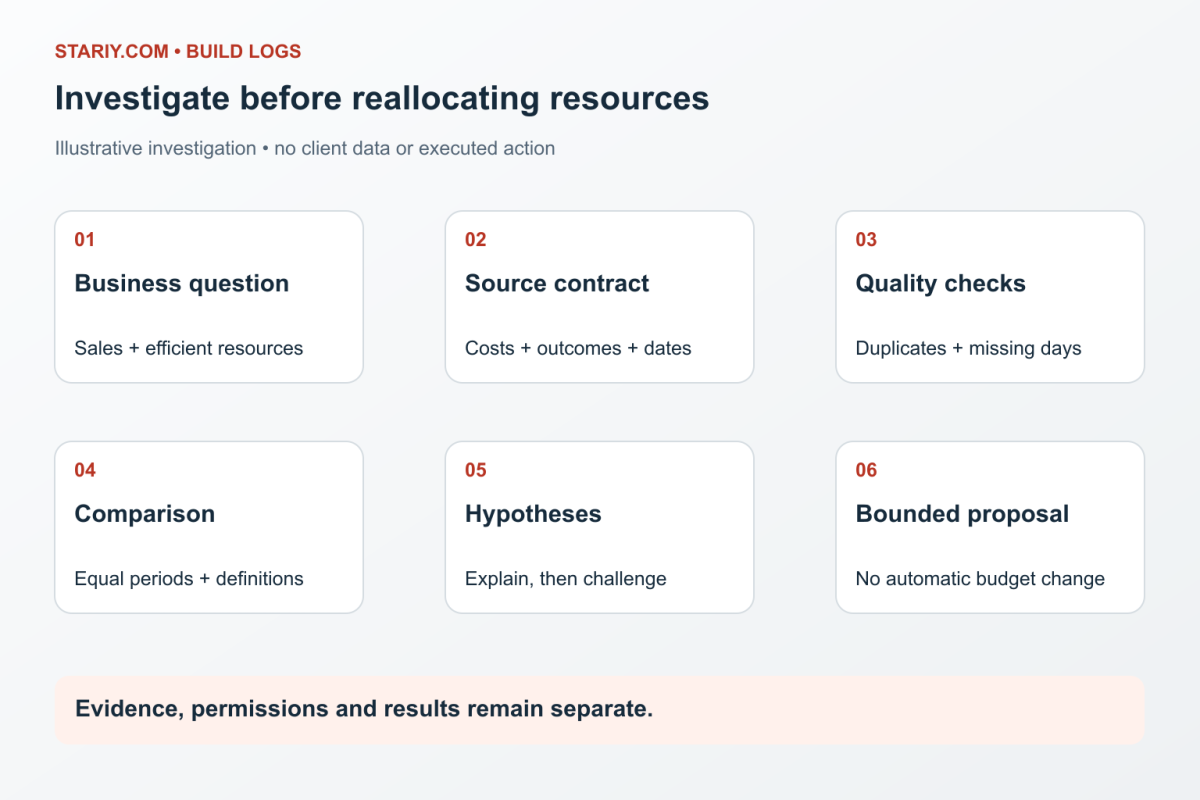
“Which channel deserves more budget and more of the team’s time?” sounds like a simple ranking question. It becomes a different problem when low-cost leads are unqualified, attributed revenue is duplicated, costs are incomplete or sales need weeks to mature.
This walkthrough shows how I structure that task in my AI OS: establish the objective, retrieve existing evidence, check it, compare compatible periods, challenge an explanation and prepare a bounded decision. The process is used in project work; all business figures, channel allocations and illustrated actions below are fictional. No client performance or executed budget change is disclosed.
This walkthrough reuses the fictional scenario in Building a Marketing Decision System. That article explains the dashboard architecture; this one follows the investigation and decision process. Reused figures are not a second client outcome.
Turn the request into an evidence contract
The request is not “find more traffic.” It is to increase sales and qualified demand while using money and human effort efficiently. The example target is at least $10 of revenue for each $1 spent on advertising and marketing delivery. This is an objective, not a promised result.
Define the population, services, geography, currency, business timezone, outcome maturity and available capacity. Record which costs belong in the calculation. A marketing revenue ratio including labour and delivery is different from advertising-platform ROAS, and neither alone measures profit or incrementality.
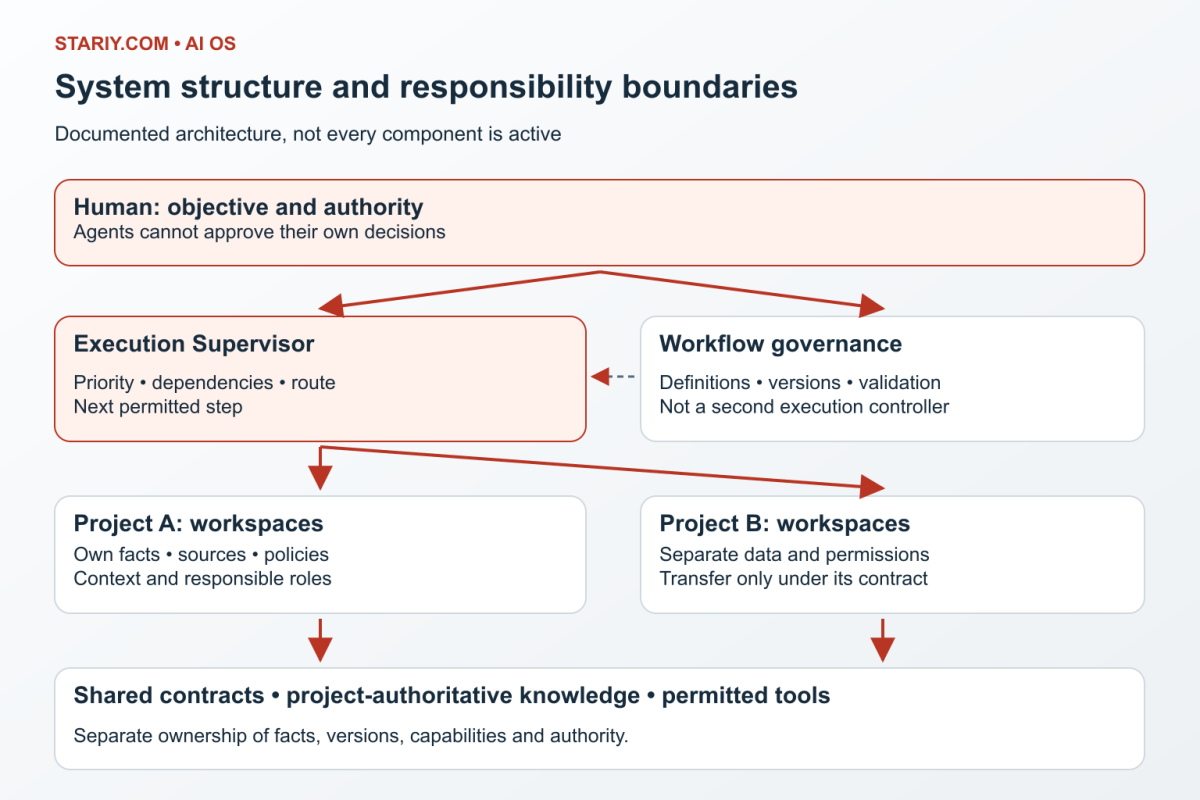
The task also needs an authority boundary. An analytical workspace can investigate and recommend. It cannot turn the request into permission to change live campaigns or assign people outside their agreed responsibilities.
Retrieve existing history before collecting again
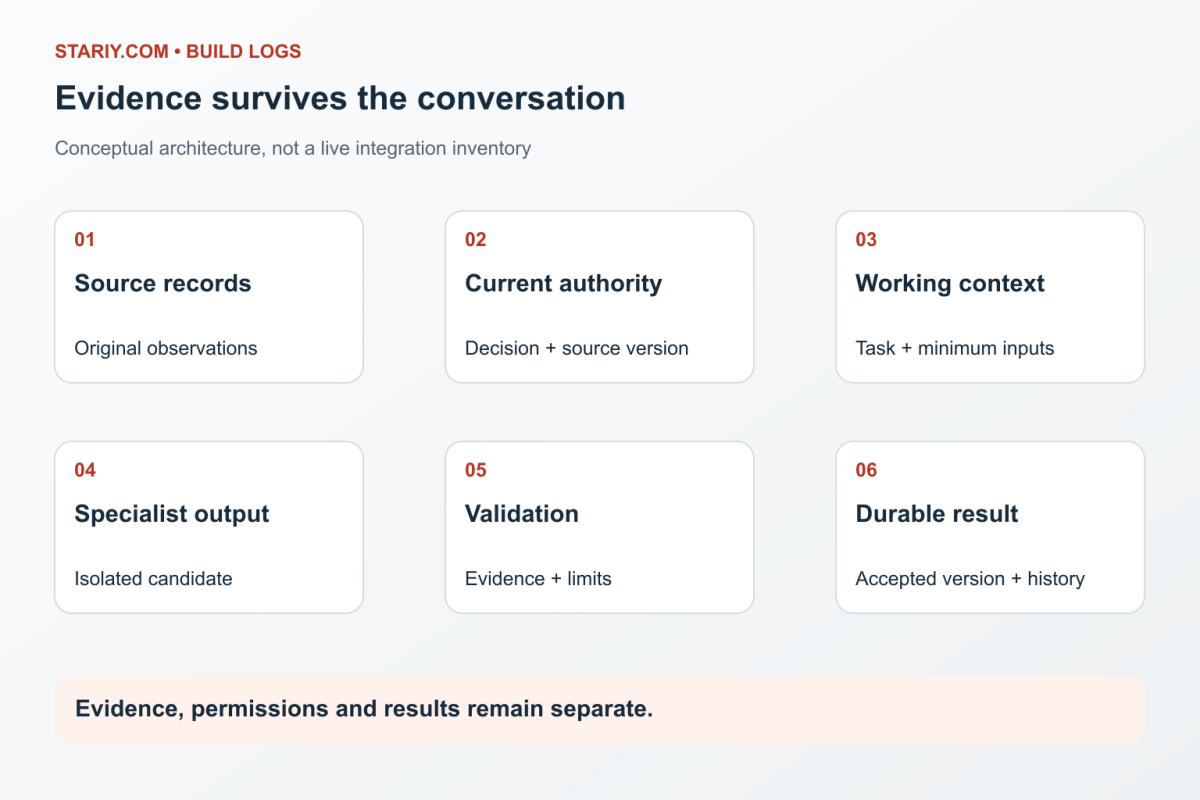
The workflow first resolves project instructions, current decisions, source inventories and retained evidence. This prevents an older report or incomplete serving table from silently controlling the conclusion.
The source contract separates advertising spend, website behaviour, calls, CRM qualification, paid orders, refunds, partner evidence and marketing delivery costs. Each source has an observation cutoff, grain and status. Collect only a missing or revised interval through an authorized route.
Use daily history for compatible comparisons and more detailed events for journey reconstruction. Keep an event layer for promotions, launches, stock changes, technical incidents and relevant external conditions. A future event is planning context, not an observed cause of current sales.
Reject misleading joins and attribution shortcuts
Before interpreting performance, the validation step checks duplicate keys, missing days, time boundaries, currency and order status. A join must not turn one order into several rows that are then summed as several sales.
Preserve raw UTM, referrer and permitted click evidence beside the derived channel classification. Several coherent signals can explain a malformed field; genuinely competing strong trails require an unresolved classification. Do not automatically call every social referrer a paid campaign.
First-touch, last-eligible-touch and multi-touch views may answer different questions about the same customer path. Their totals should reconcile separately to the relevant outcome population. Adding the models together invents extra revenue. Tracking a path does not establish that advertising caused an incremental purchase.
When a required source is stale, show the last verified cutoff and the affected limitation. Do not replace unavailable revenue with platform conversion value or missing history with zero.
Compare the business result rather than one attractive metric
The synthetic example uses 1–28 September 2026, 1–28 August 2026 and 1–28 September 2025, in USD and Europe/Kyiv. Revenue means recognized revenue after refunds; the cost denominator includes advertising and allocated marketing delivery costs. These are equal-length windows, not a complete seasonal adjustment.
| Metric | Current | Previous month interval | Prior year interval |
|---|---|---|---|
| Revenue | $200,000 | $150,000 | $100,000 |
| Advertising and delivery cost | $18,000 | $15,000 | $12,000 |
| Revenue per $1 of combined cost | 11.11 | 10.00 | 8.33 |
Revenue rises 33.3% month over month and 100% year over year; combined costs rise 20% and 50%. The ratio improves 11.1% and 33.3%. These are internally checkable demonstration calculations, not results achieved for a client.
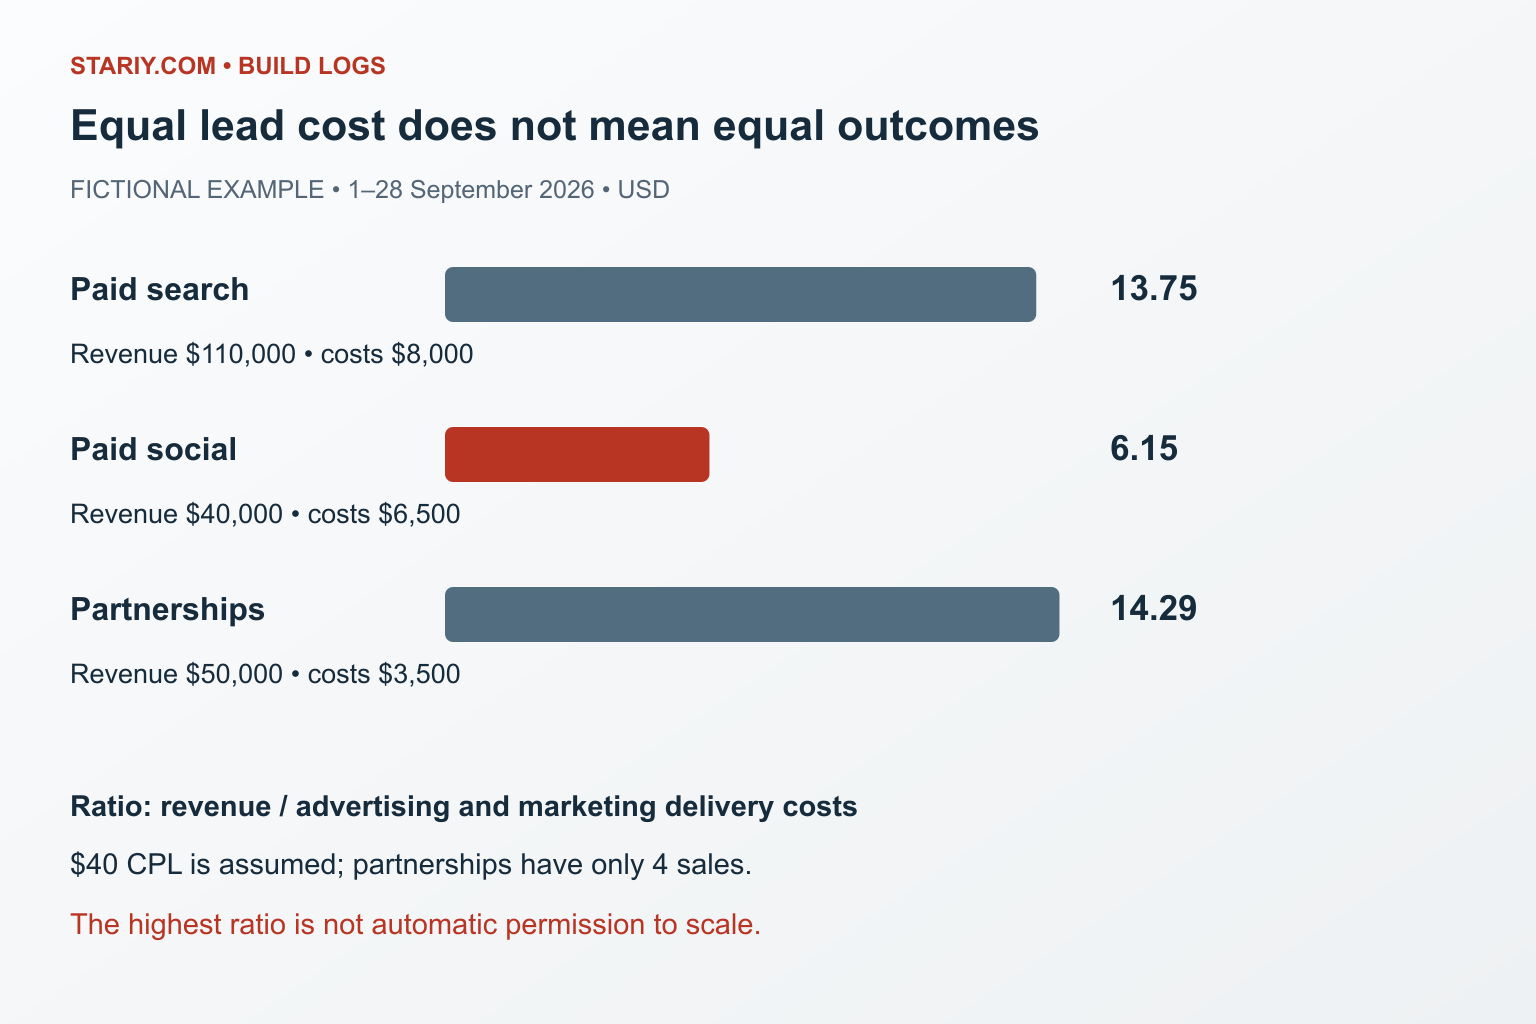
At channel level, paid search has $110,000 of revenue against $8,000 of combined costs, or 13.75. Paid social has $40,000 against $6,500, or 6.15. Paid partnerships have $50,000 against $3,500, or 14.29. The channel totals reconcile to the current overview under the example’s exclusive first-touch rule.
All three have a $40 advertising cost per lead. That apparently equal acquisition cost hides a different qualified-lead and sales mix. Partnerships also have only four sales, so the strongest-looking ratio has a small evidence base.
Let an analytical agent explain and a review step challenge
An agent can calculate the comparisons, identify discrepancies and retrieve related historical events. It should produce a sourced observation and possible explanations, not a confident causal story unsupported by the data.
For example: “Social has the weakest all-in ratio in this window.” Possible explanations include poorer lead qualification, a different service mix, slower follow-up or less mature sales. Those are hypotheses until additional evidence distinguishes them.
A separate review checks whether the same population and definitions were used, whether costs are complete, and whether an attractive channel has enough realized outcomes. For a small task, a distinct review pass may be enough; a team of agents is not a requirement.
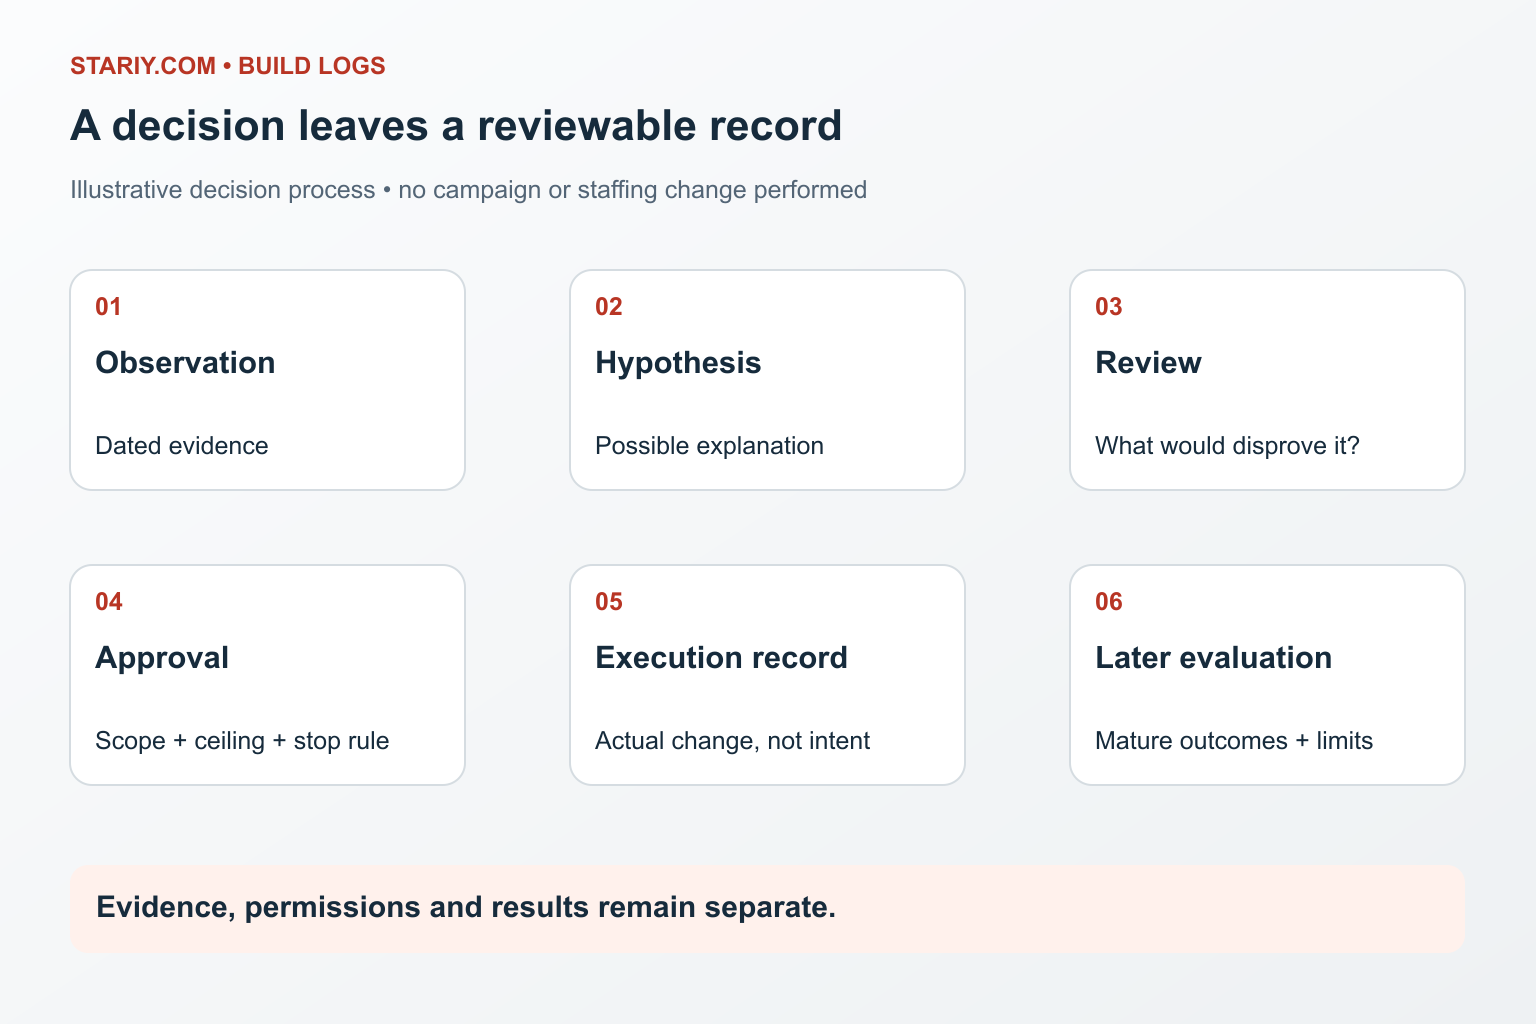
The decision workspace receives a compact package: observation, source window, validated calculation, open limitations, proposed action and what would falsify the hypothesis. Private raw customer records do not need to appear in the public explanation.
Make a bounded decision and evaluate it later
The illustrative recommendation is to investigate social qualification and response time, then consider a limited resource increase in a better-supported channel if capacity, maturity and attribution checks pass. It is not an instruction to cut all social activity or automatically scale partnerships.
An accepted test would need a budget ceiling, time allocation, responsible role, review date and stop condition. Advertising execution and business approval remain with the authorized people. The workflow records the actual implementation, not just the intention.
Evaluation then checks comparable outcomes, cost completeness, sales-cycle maturity and unexpected effects. If a holdout or other suitable experimental design is available, it can provide stronger evidence about incrementality. Without it, report an observed association or accounting change rather than a causal sales uplift.
Preserve the result for the next task
The SSOT receives the accepted analysis, evidence references, decision status, unresolved issues and next check. If later data revises revenue or exposes an attribution conflict, the correction is dated and linked to the previous result instead of silently rewriting history.
The useful outcome is not a prettier report saying that marketing is doing well. It is a decision that can be inspected, an action whose authority is clear, and a later evaluation that can teach the next task something new.