
Multi-Agent Systems: Collaboration Patterns Costs and Failure Modes
October 14, 2026
A2A 1.0: Why Agent-to-Agent Communication Needs a Real Protocol
October 14, 2026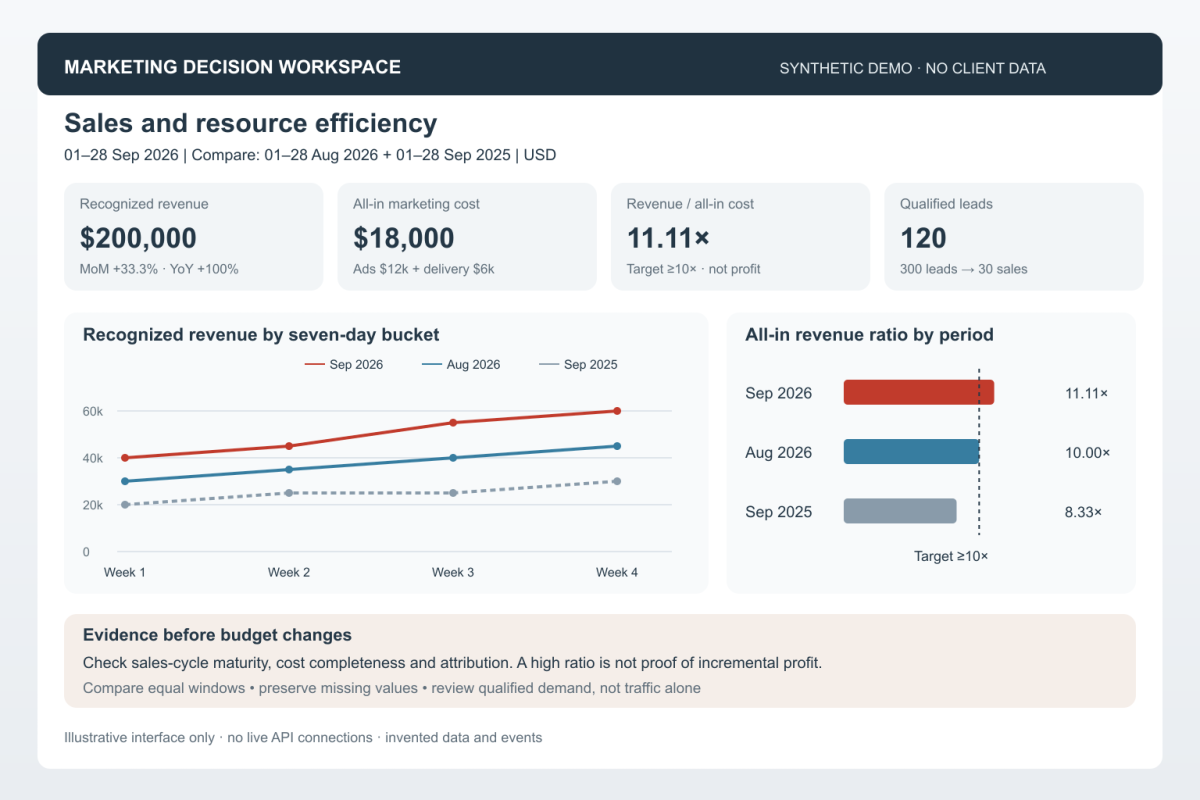
The starting problem was not a shortage of charts. It was insufficient visibility into where customers came from, which channels deserved more attention and budget, and whether marketing work was producing a worthwhile business return.
More traffic, better rankings and attractive advertising statistics can be useful signals. They are not the final objective. My priority is to increase sales and qualified demand, use human and financial resources effectively, and help people make informed decisions while there is still time to act.
This is not exclusively a pilot-stage idea. My work includes operational dashboards, systems that are being improved while in use, and new implementations being built alongside a developing project. Their coverage and automation differ. A working dashboard does not mean every source or workflow has already reached its final state.
To respect client confidentiality, the architecture below combines reusable methods into one fictional business. All illustrated values, customer paths, events and interface examples are synthetic. They are not anonymized client records, client screenshots or evidence that a particular revenue target has been achieved.
Define the business objective and its denominator
The objective in this example is at least $10 of revenue for every $1 invested in marketing work and advertising, with a working ambition to exceed that level. It is a target, not a guaranteed outcome or a universal benchmark.
Three different measurements must remain distinct. Platform ROAS uses the conversion value reported by an advertising platform divided by advertising spend. A reconciled business advertising ROAS uses first-party revenue attributed under an explicit rule divided by the corresponding advertising spend. An all-in marketing revenue ratio includes the broader marketing cost base in its denominator.
In this demonstration, the all-in ratio is recognized revenue after refunds ÷ advertising and marketing delivery costs. Delivery costs include recorded labour, content production, partner fees and allocated tools. Taxes and currency treatment must be consistent. Actual, committed, forecast and approved-budget costs remain separate.
This broader ratio answers the investment question more closely than advertising ROAS alone. It is not a profit margin, after-cost ROI or proof of incremental revenue. Product costs, fulfilment, payment fees and other operating costs still matter. Google Ads describes its target ROAS in terms of conversion value per advertising cost; adding labour changes the denominator and therefore the metric. Google Ads target ROAS documentation
Build one coherent architecture from several source families
The composite design connects source families used across my marketing work without pretending that every client uses the same stack or has every integration active.
| Source family | What it contributes | What it cannot establish alone |
|---|---|---|
| Google Ads and Meta Ads | Spend, delivery, campaign and creative diagnostics | Unique customers, reconciled revenue or incrementality |
| GA4 and Google Tag Manager | Website events, acquisition and measurement configuration | Qualification, payment or profit |
| Search Console, Google Business Profile and DataForSEO | Search visibility, local interactions, selected demand and SERP context | A complete market-demand census or confirmed sales |
| Ringostat and CRM | Calls, enquiry records, qualification stages and lead progression | A sale from every call or a valid source join without identifiers |
| WooCommerce and Metorik | Orders, payment status, products and refunds | A causal advertising effect |
| Creator, affiliate and collaboration registers | Tracked links, codes, publications, referrals and partner evidence | Incrementality merely because a code was used |
| Social analytics and verified publication records | Audience and content response | Business revenue without a transaction link |
| Mouseflow | Behaviour and funnel diagnostics | An additive replacement for GA4 sessions |
| Merchant Center and product catalogues | Product eligibility, stock, price and product identifiers | Paid sales or demand without outcome evidence |
| Performance tests, CrUX, Sentry and availability monitoring | Technical conditions that may affect customer journeys | Revenue lost because two events occurred together |
| Cost, work and change registers | Labour, fees, tools, promotions, releases and decisions | Payment merely because an invoice exists |
| Event calendars and external context | Holidays, industry events, weather and relevant economic conditions | A proven demand effect without further analysis |
Social analytics is an optional lane where an authorized source is available. Financial, CRM and event inputs can have different collection mechanisms. The design preserves those differences rather than labelling every row as an automated API feed.
Make the SSOT a historical evidence base
The single source of truth is more than the dashboard’s current numbers. It preserves source-native snapshots, documented transformations, accepted datasets, metric definitions and the decisions made from them.
Retain history by source and observation date. Where daily data is available, preserve it so an analyst can compare selected days, weeks, equal-length months and corresponding periods across years. Keep finer-grained events where needed to reconstruct a customer journey. Monthly field-performance evidence should stay monthly; it cannot be turned into invented daily observations.
The size of the base should be described by usable coverage, not an impressive storage figure. Useful indicators are the earliest and latest verified date per source, covered days, missing intervals, distinct business entities and accepted records at each declared grain. Copies, retries and overlapping exports are not additional customers or additional history.
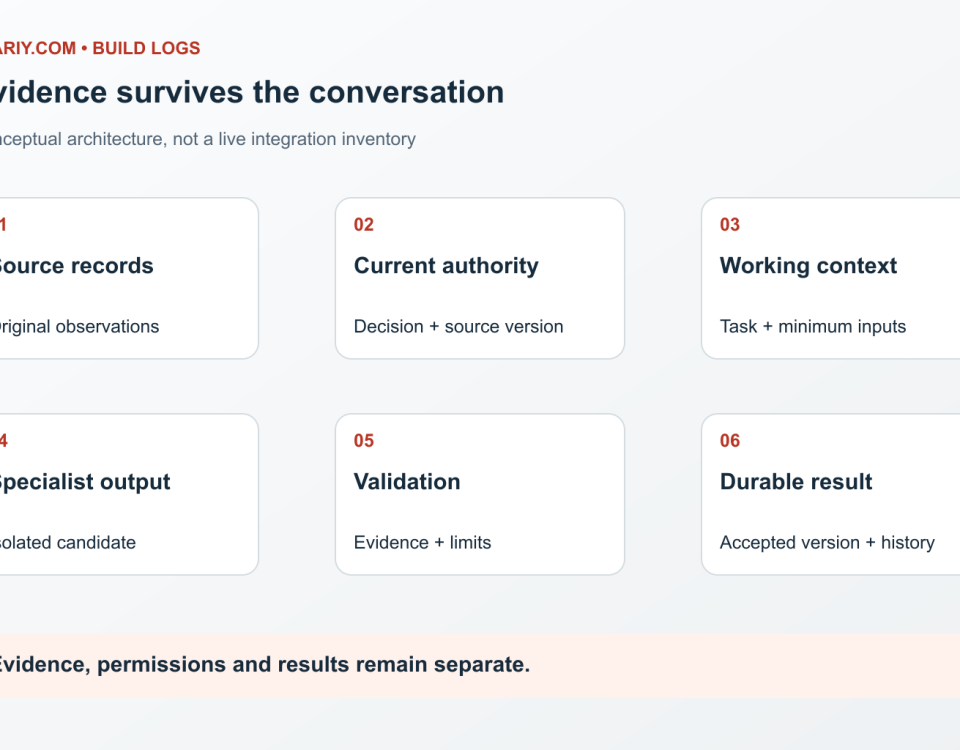
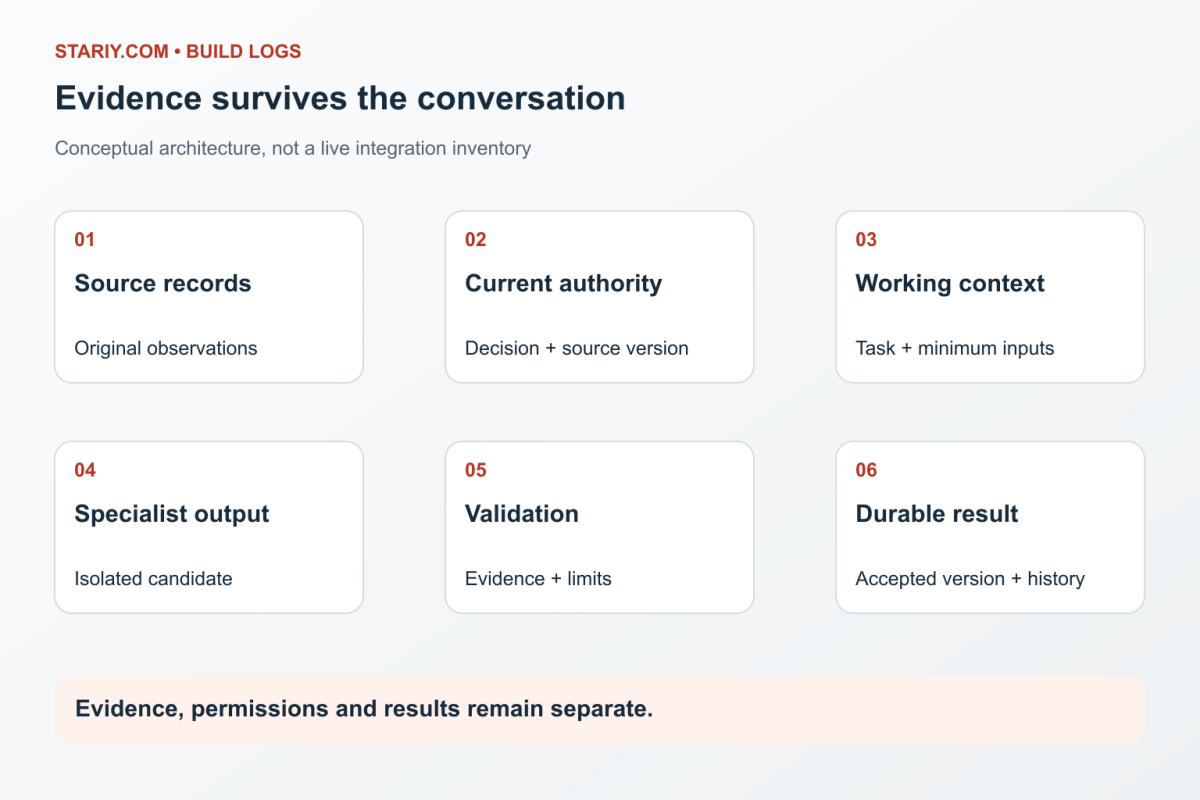
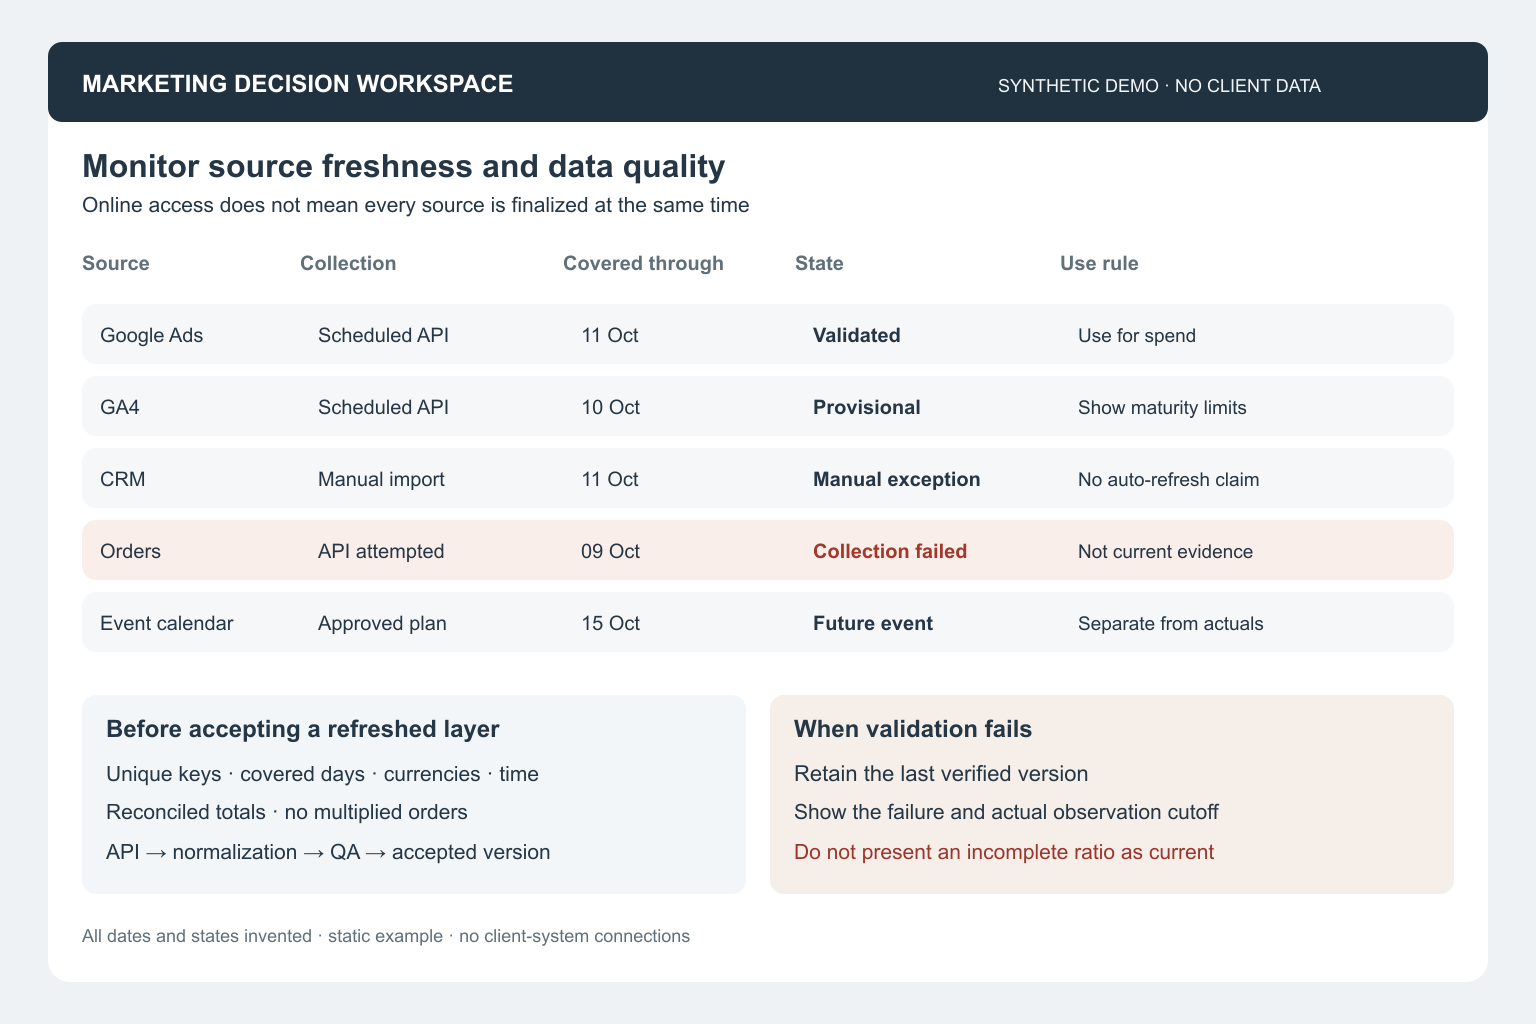
A source-by-date coverage register makes incomplete periods visible. Preserve raw records unchanged, normalize reproducibly, validate the derived layer, and expose only an accepted version. A failed refresh must not replace the last verified version.
Automate collection without hiding freshness limits
For supported and authorized sources, the production pattern is scheduled API collection followed by incremental processing, quality checks and publication to the analytical layer. The system should collect missing or revised intervals rather than download everything again on every refresh.
Each source needs its own last successful collection time, observation cutoff, refresh status and provisional or finalized label. A dashboard refresh is not proof that the source has new data. Unsupported sources, manual imports and unavailable credentials must remain explicitly labelled exceptions, not simulated successful API connections.
Google Analytics uses different processing intervals and its reported values can change as processing and attribution mature. A reporting tool can also cache data independently of the upstream source. Google Analytics data freshness, Google documentation on reporting data freshness
The fictional dashboard illustrations demonstrate how those states should be presented. They are not connected to APIs and do not show genuine refresh timestamps.
Reconstruct the customer journey before assigning credit
Correct tagging starts with a controlled naming convention, not a different UTM label invented by each contractor. Retain campaign, creative, partner and publication identifiers where reliable. Capture click identifiers and source evidence only under the applicable consent and privacy rules. Never place personal information in tracking URLs.
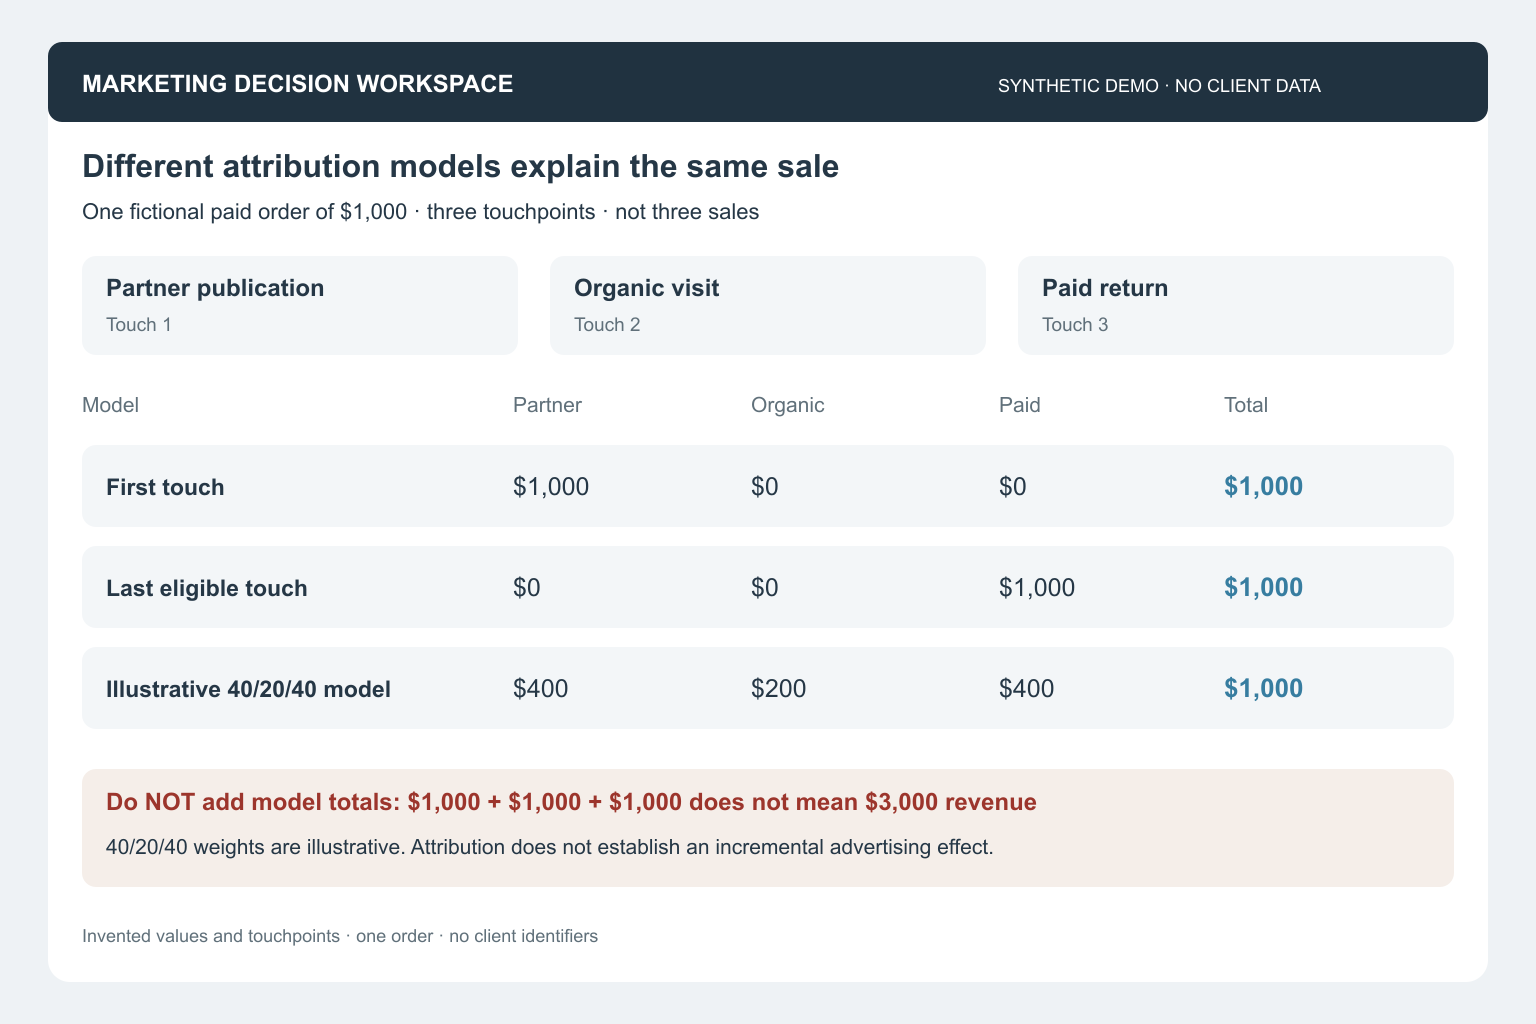
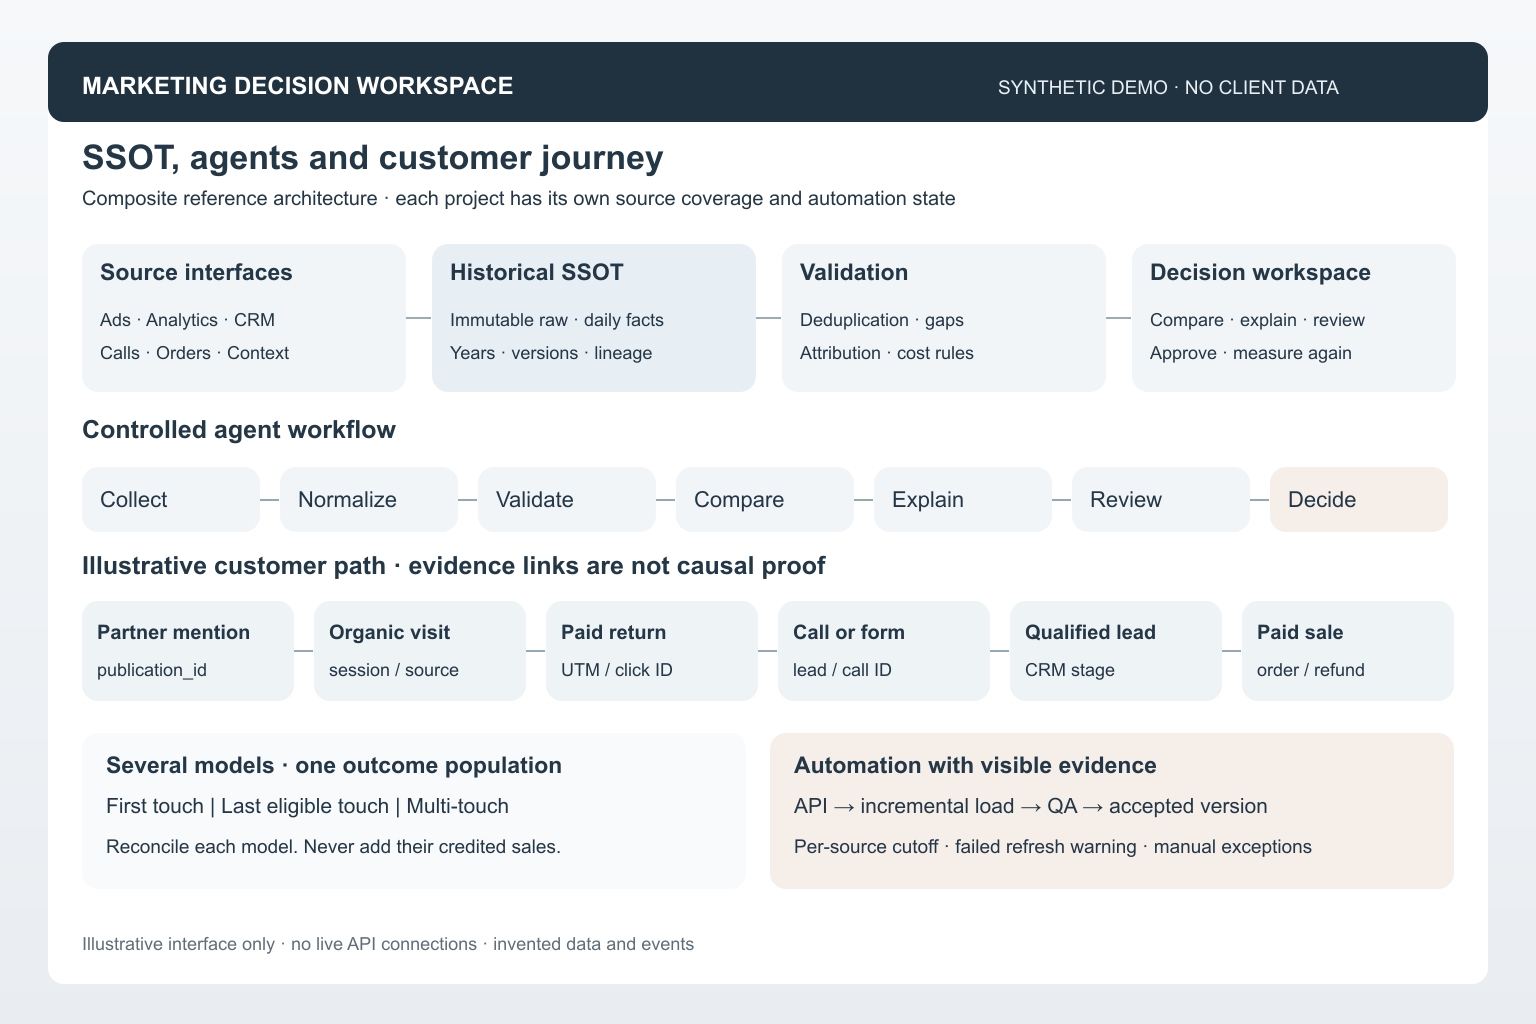
A typical journey might contain a partner publication, an organic visit, a paid-search return, a call, a qualified CRM record and a paid order. Stable identifiers and permitted linkage should connect those stages. Preserve the original evidence and the reason for every inferred link; unknown or conflicting attribution must stay visible.
Compare several views when the question requires them: first touch for initial discovery, last eligible touch for the final recorded acquisition step, and an explicitly defined multi-touch view for the observed path. An assisted touch is not another sale. Each model explains the same reconciled outcome population; its credited revenue must reconcile within that model, not be added across models. Google Analytics attribution settings also have specific reporting scope. Google Analytics attribution settings
Separate acquisition-period analysis from lead-cohort analysis. September advertising spend and September payments may relate to different journeys if the sales cycle takes several weeks. A cohort view can follow September’s leads to later qualification and payment, with a visible maturity cutoff. Attributed revenue is still not proof that advertising caused an incremental sale.
Use agents and workspaces as a controlled workflow
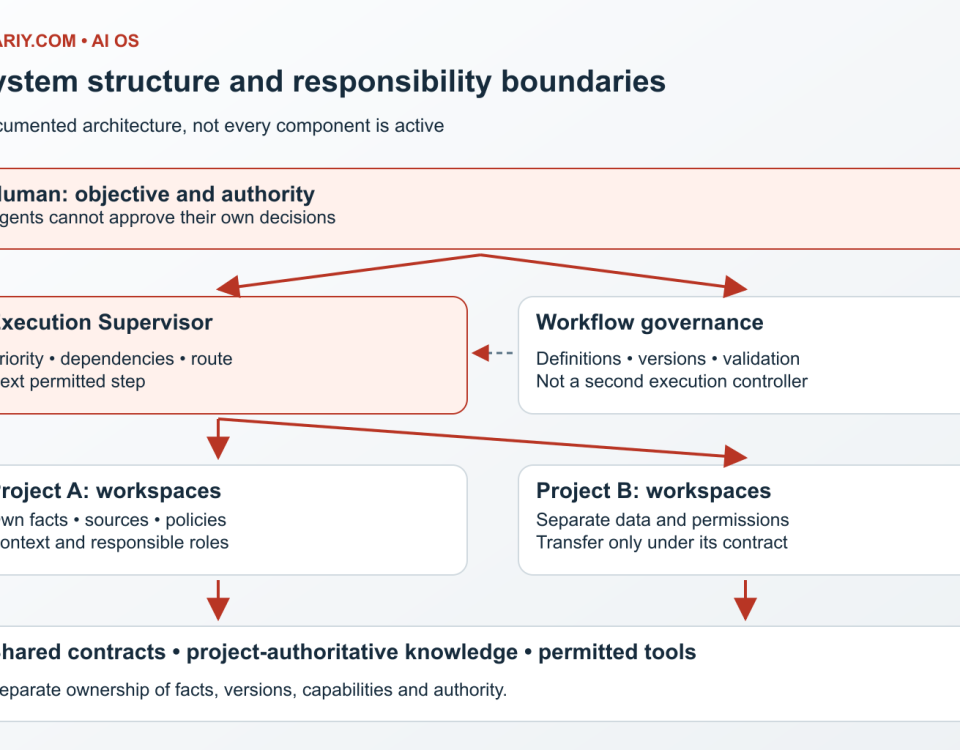
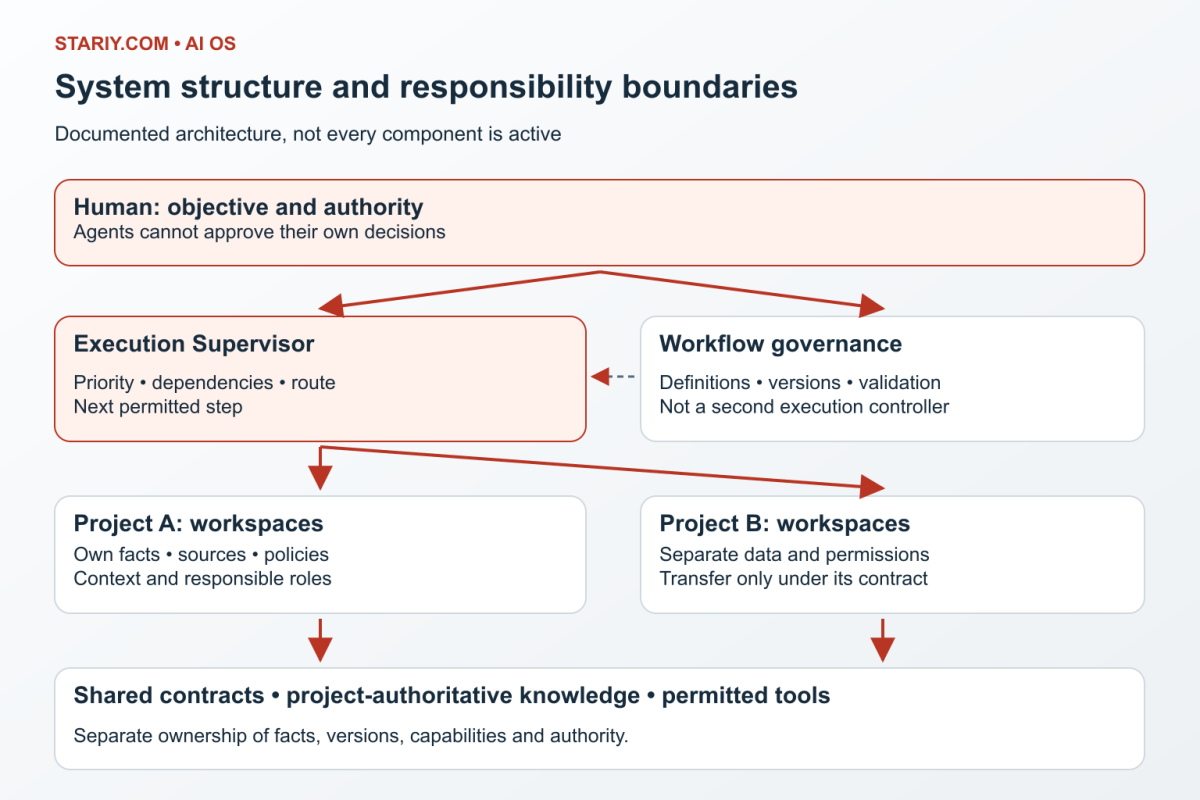
Specialized workspaces preserve source rules, evidence and unfinished tasks without forcing every question through one giant conversation. A collection workflow retrieves approved evidence. A validation workflow checks coverage and semantics. An analytical workflow calculates compatible comparisons. A review workflow challenges conclusions. A decision record captures the accepted action and later evaluation.
AI agents can assist at these boundaries: detect schema changes, flag duplicate records, summarize a verified change, find relevant historical events and prepare an investigation. They should share references to accepted SSOT evidence rather than maintain competing copies of the truth.
More agents are not automatically better. Keep responsibilities explicit, avoid concurrent writers to the same record, and retain a human approval gate for changing advertising, budgets, tracking or business systems. Each handoff should carry its scope, source version, validation result, unresolved limitations and next permitted action.
The practical chain is collect → normalize → validate → compare → explain → review → decide → check the result. Read-only analytical automation and authority to execute a commercial change are different permissions.
Compare periods in the interface
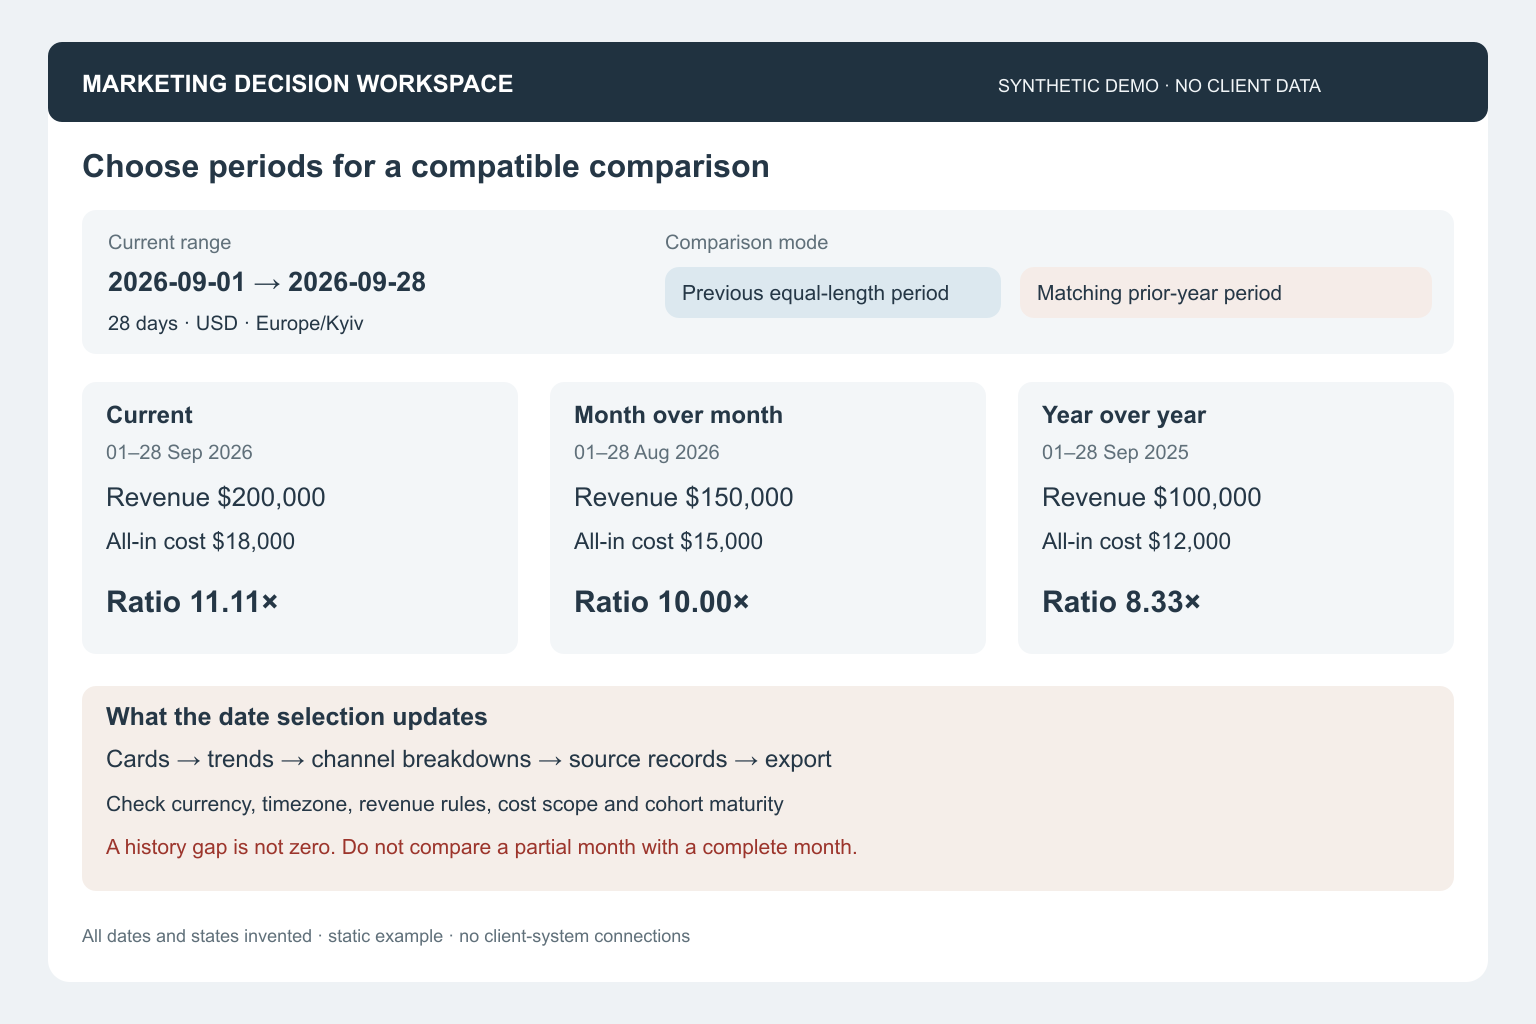
The executive view should expose the selected start and end dates, business timezone, comparison method and outcome maturity. Offer previous equal-length period and corresponding prior-year period alongside a custom comparison. Show exact dates, not an unexplained label such as last month.
Use the same population, currency, timezone, revenue definition and cost coverage in both periods. For a month in progress, compare the same elapsed interval rather than a partial month against a complete one. Retain explanations for unavailable comparisons instead of zero-filled gaps. Recompute ratios from total numerators and denominators after filters change.
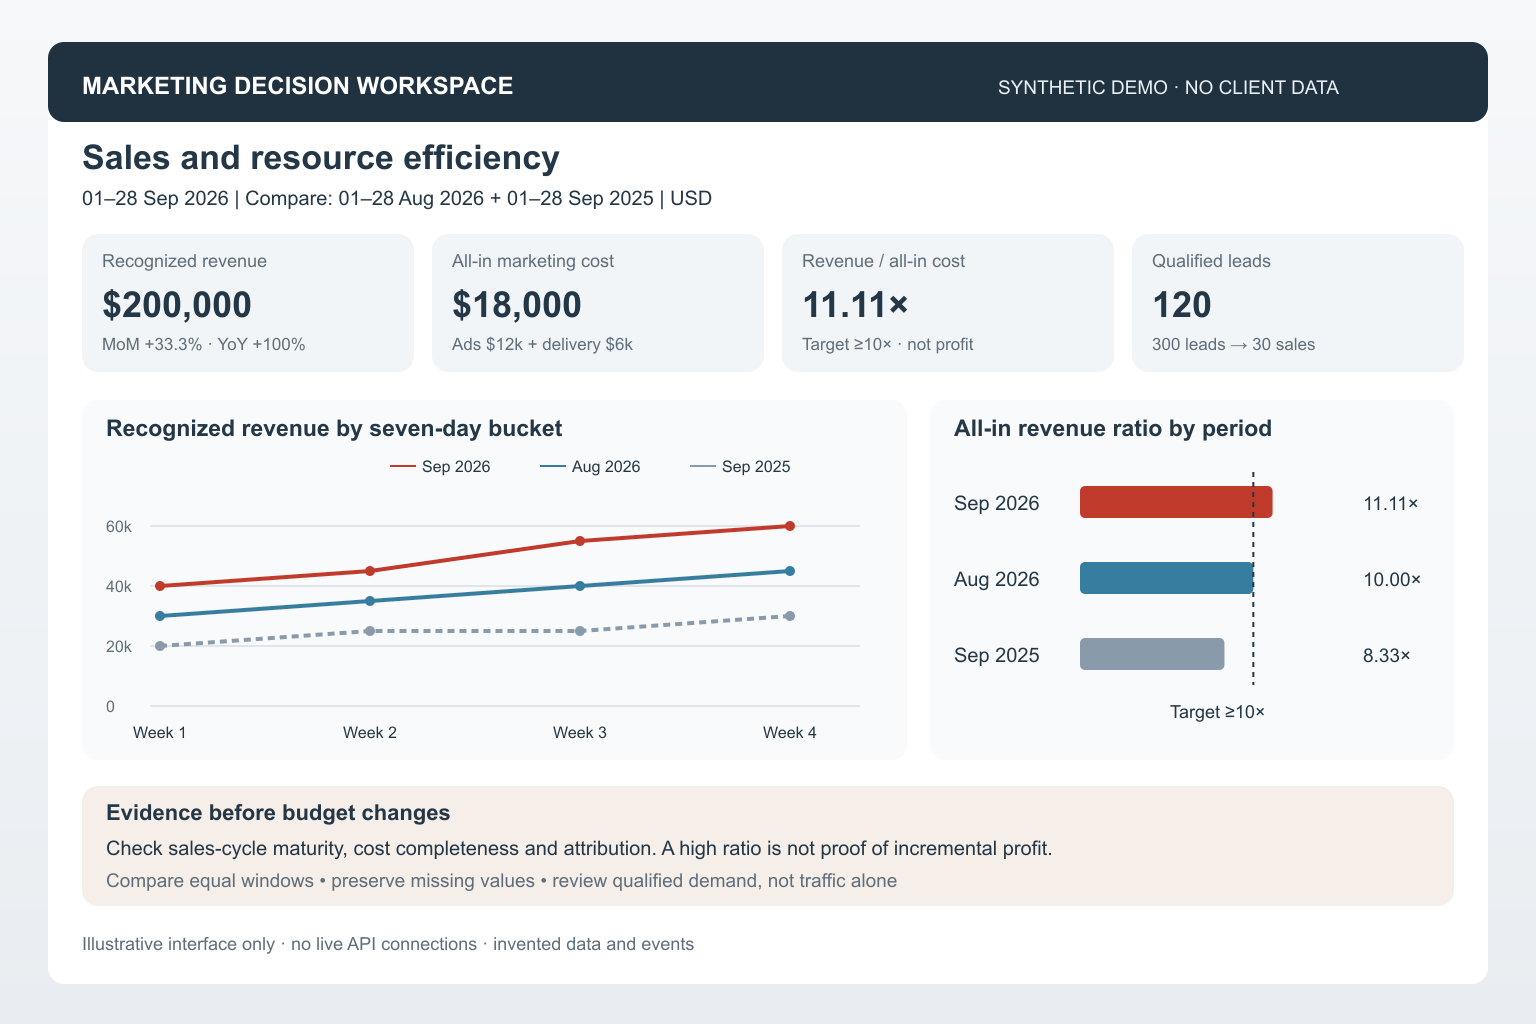
The illustrations use three equal 28-day windows: 1–28 September 2026, 1–28 August 2026 and 1–28 September 2025. Daily history is summarized into four seven-day buckets for legible trend lines. A production selector should update cards, charts, tables and export scope together.
A synthetic decision example
The fictional current window has $200,000 of recognized revenue, $12,000 of advertising spend and $6,000 of marketing delivery costs. The all-in ratio is 11.11, against a target of at least 10. The previous equal-length window has $150,000 of revenue and $15,000 of combined costs, giving a ratio of 10. The prior-year window has $100,000 and $12,000, giving 8.33.
Revenue is therefore up 33.3% month over month and 100% year over year; combined marketing costs are up 20% and 50%. The all-in ratio rises 11.1% and 33.3%. These calculations describe an invented example, not a client achievement.
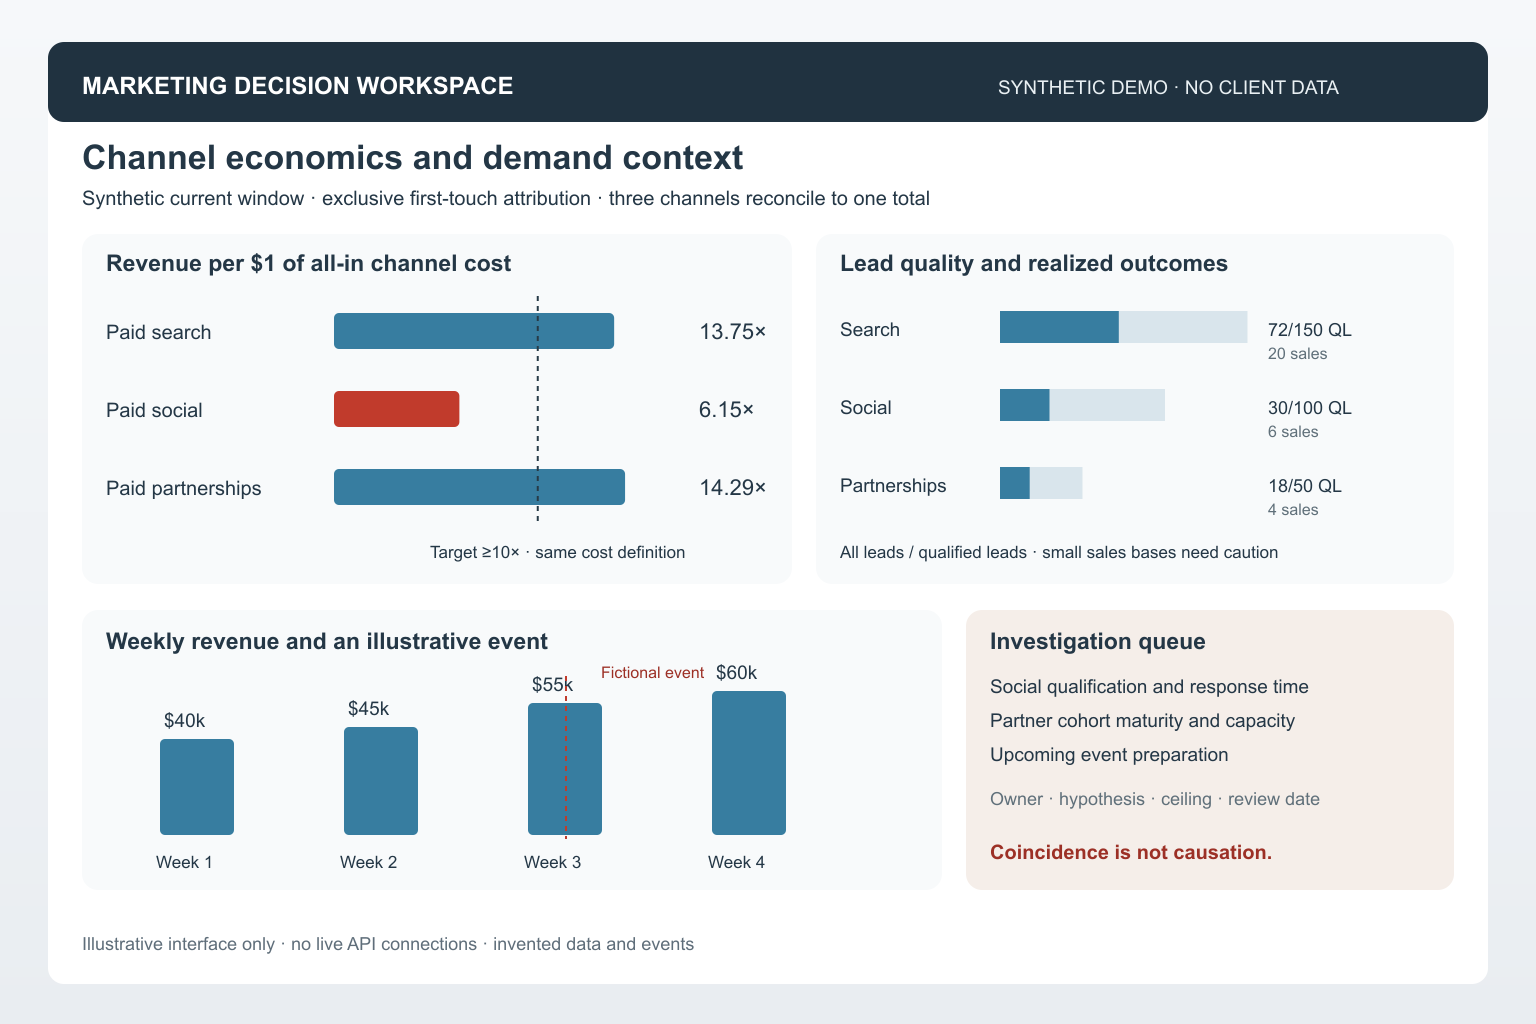
The channel view makes the next question more useful. Paid search produces $110,000 of attributed revenue against $8,000 of advertising and allocated delivery costs, a ratio of 13.75. Paid social produces $40,000 against $6,500, or 6.15. Paid partnerships produce $50,000 against $3,500, or 14.29.
All three have a $40 advertising cost per lead, yet their qualified-lead rates and sales differ. Selecting the cheapest-looking lead source would miss the business distinction. Partnerships have only four closed sales in this example, so the attractive ratio has a small outcome base and should not justify unlimited scaling.
The proposed decision is to investigate social lead qualification, service mix and sales response, while testing a bounded increase in a better-supported channel only after checking capacity, attribution and cohort maturity. Record a budget ceiling, responsible role, expected signal, stop condition and review date. Do not manufacture a claim that the test has already increased sales.
Bring seasonality and future events into planning
Add an event layer for launches, promotions, trade events, holidays, stock changes, website incidents and relevant external conditions. Align it with the correct geography and business timezone, and distinguish observed events from upcoming plans.
In the fictional trend illustration, a demand event coincides with a stronger week. That is a prompt to investigate, not proof of causation. Compare several years where compatible history exists, similar weekdays, unaffected segments and sales-cycle delays. Small samples and concurrent promotions can make a simple explanation misleading.
For upcoming events, show scenarios separately from actuals. Useful preparation can include allocating staff time, checking inventory or service capacity, preparing landing pages and creative briefs, and defining measurement before launch. The objective is to act earlier with better evidence, not promise prediction of every market change.
Keep verification visible
The most reusable checks are straightforward but consequential. Reconcile realized orders and refunds against advertising-platform claims. Check duplicates and missing days. Prevent joins from multiplying orders. Preserve unresolved source conflicts. Validate campaign and product mappings. Align currency and time boundaries. Do not add GA4 and behaviour-tool sessions together or substitute a call count for qualified leads.
Every material recommendation should be traceable to its source window and an accepted calculation. The interface should also expose unsupported comparisons, source delays and failed refreshes. A convincing visual is not a substitute for this evidence contract.
Weekly and monthly reports remain useful for explaining what changed, why the team chose an action and what happened afterward. An interactive decision system makes the evidence available between those reports. Its value is not showing that marketing is busy. Its value is helping the business sell more effectively, waste fewer resources and respond before an opportunity or problem becomes obvious to everyone.